2. 2018 Hurricane Michael
Hurricane Michael was a category 5 hurricane, which made landfall in Florida on October 10, 2018. The peak wind speed and the minimum surface pressure reached 140 knots and 919 hPa, respectively.
2.1. Model Configuration and Datasets
The case was initialized at 00z Oct 07, 2018 and forecast out to 120 hours. The app uses ./xmlchange to change the runtime settings. The settings that need to be modified to set up the start date, start time, and run time are listed below.
./xmlchange RUN_STARTDATE=2018-10-07,START_TOD=0,STOP_OPTION=nhours,STOP_N=120
Initial condition (IC) files are created from GFS operational dataset in NEMSIO format. The Stand-alone Geophysical Fluid Dynamics Laboratory (GFDL) Vortex Tracker is a tool to estimate hurricane tracks and intensities. The Best Track dataset provides the ‘truth’ data for hurricane evolution.
The GFS model EMC global workflow points to the most up-to-date GFS model development code. The GFS.v16.0.10 is tested in C768 (~13km) resolution and in 128 vertical levels. It uses two scripts, setup_expt_fcstonly.py and setup_workflow_fcstonly.py to set up the mode simulation date and case directories.
The case was initialized at 00z Oct 07, 2018 and forecast out to 120 hours. The settings that need to be modified to set up the start date and directories are listed below.
./setup_expt_fcstonly.py --pslot Michael --configdir /PATH/TO/YOUR/GLOBAL/WORKFLOW/parm/config --idate 2018100700 --edate 2018100700 --res 768 --comrot /PATH/TO/YOUR/EXP/DIR/comrot --expdir /PATH/TO/YOUR/EXP/OUTPUT/expdir
The account and simulation duration time can be set up in /expdir/Michael/config.base file.
./setup_workflow_fcstonly.py --expdir /PATH/TO/YOUR/OUTPUT/expdir/Michael
Next step is to go to /expdir/Michael to submit the run by
crontab Michael.crontab
The case was initialized at 00z Oct 09, 2018 and forecast out to 90 hours. The app uses config.sh to define the runtime settings. The settings that need to be modified to set up the first cycle, last cycle, cycle hour, and fcst length are listed below.
FCST_LEN_HRS="90"
LBC_SPEC_INTVL_HRS="6"
DATE_FIRST_CYCL="20181009"
DATE_LAST_CYCL="20181009"
CYCL_HRS=( "00" )
Initial condition (IC) and boundary condition (BC) files are created from GFS operational dataset in NEMSIO format.
2.2. Case Results
2.2.1. Hurricane Track and Intensity
Hurricane tracks from MRW_GFSv16beta (blue line), MRW_GFSv15p2 (red line), and Best Track (black line). The dots are color coded with the vortex maximum 10-m wind speed (WS, kt).
MRW_GFSv16beta and MRW_GFSv15p2 generate left-of-track bias. Hurricane track from MRW_GFSv15p2 is closer to the Best Track compared with MRW_GFSv16beta.
MRW_GFSv16beta and MRW_GFSv15p2 do not capture the hurricane intensities (represented by max WS), especially before the landfall.
Time series of the vortex maximum surface wind speed (WS, left panel) and minimum mean sea level pressure (MSLP, right panel)
The maximum surface wind speed at the vortex center in MRW_GFSv15p2 (80 kts) is larger than MRW_GFSv16beta (60 kts). However, both two physics compsets do not reach the peak intensity identified in Best Track data (140 kts).
The minimum sea level pressures from MRW_GFSv15p2 and MRW_GFSv16beta are 965 hPa and 985 hPa, respectively, which are larger than Best Track data.
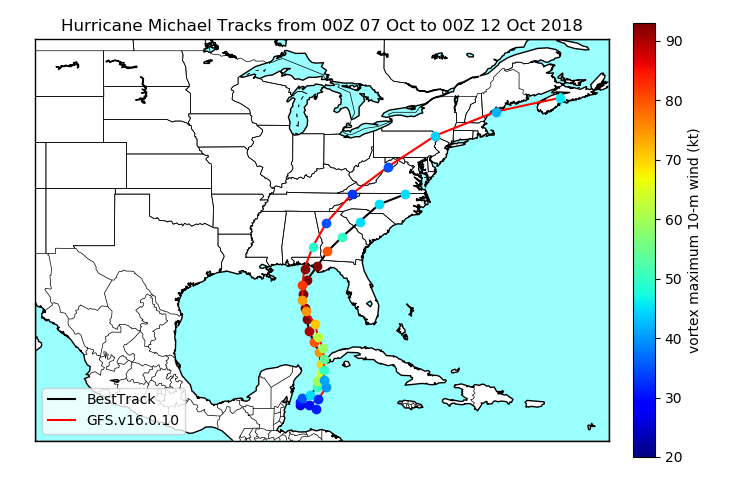
Hurricane tracks from GFS.v16.0.10 (red line) and Best Track (black line). The dots are color coded with the vortex maximum 10-m wind speed (WS, kt).
GFS.v16.0.10 generates left-of-track bias.
Time series of the vortex maximum surface wind speed (WS, left panel) and minimum mean sea level pressure (MSLP, right panel)
The maximum surface wind speed at the vortex center in GFS.v16.0.10 reaches 90 kts, which is 50 kts lower than Best Track data.
The minimum sea level pressure from GFS.v16.0.10 is 950 hPa, versus 919 hPa from Best Track data.
Hurricane tracks from SRW_GFSv15p2 (purple dash line), MRW_GFSv16beta (blue line), MRW_GFSv15p2 (red line), and Best Track (black line). The dots are color coded with the vortex maximum 10-m wind speed (WS, kt).
Hurricane track from SRW_GFSv15p2 is closer to the Best Track compared with MRW_GFSv15p2 and MRW_GFSv16beta.
Due to lack of information contained in the initial and boundary condition files for this relatively old (2018) case, the SRW App could not run with suite
SRW_RRFSv1alpha.
Time series of the vortex maximum surface wind speed (WS, left panel) and minimum mean sea level pressure (MSLP, right panel)
The maximum surface wind speed at the vortex center in SRW_GFSv15p2 (90 kts) does not reach the peak intensity identified in Best Track data (140 kts).
The minimum sea level pressure from SRW_GFSv15p2 is 948 hpa, which is larger than Best Track data.
2.3. Summary and Discussion
The GFS.v16beta compset in MRW.v1.0 does not show improvements in simulating Hurricane Michael track and intensity when compared with the GFS.v15p2 compset. The physics for MRW_GFS.v16beta was frozen in Jan 2020 for the public release of UFS MRW App version 1.0. Several major changes have been made to the GFS model after that, which include more vertical levels, several tuning parameters, and modified background diffusivity as a function of stability in the PBL scheme, etc. (Yang 2020). In GFS.v16.0.10 (GitHub tag created in Jun 2020), the simulated hurricane landfall location and hurricane intensity is closer to Best Track data compared to MRW_GFSv15p2. The results from SRW App v1.0 show better track and intensity in simulating Hurricane Michael when compared to the results from MRW App v1.0, possibly because the SRW App 1.0 has a newer code base and shorter forecast time. The SRW App forecasts have shorter duration because of limitations in the availability of lateral boundary conditions for longer lead times.
References
Yang F. (2020). Development and evaluation of NCEP’s Global Forecast System Version 16. Unified Forecast System Community Webinar, Oct 22, 2020. [Link]